Monday, May 07, 2007


SPECIAL: The Top Three Chart Patterns In Growth Investing -
Markets Mostly Higher But Volume Low -
"From The Trading Desk" May 7, 2007: Is the current rally getting tired? The Nasdaq, S&P500, and Dow all made new recent highs on lower volume. The volume was especially low on the Nasdaq and S&P. The Nasdaq was down fractionally while the Dow and S&P were up a bit.

CNS, AAPL and IGLD were up on heavy volume. The solar group was mixed with FSLR making a new high on big volume. SPWR was down on strong volume.

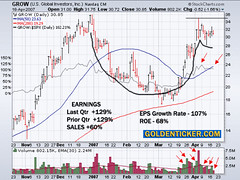
SYNL was up 4% on an almost 400% volume increase. The last base for the stock was early this year. GSOL looks to be setting up again for a Cup With Handle breakout, but it's burned us before on a steep breakout attempt.
ROCM is back at recent new lows after it's recent collpase. CYNO was up again on strong volume but it's extended. WFR is meeting resistance at the 50 day moving average. AL was up 34% on a takeover bid by Alcoa. The Shanghai market was up 2.2% today.

"Current Market Pulse":The market is in a confirmed rally and slowly moving higher. Although things are looking OK today, caution is still advised. We are at lofty short-term levels and lesser-quality names are leading the rally. I am recommending caution. Sell your weaker acting stocks. Come off margin. Buy only the best CAN SLIM stocks like the ones we suggest. Only buy stocks that are emerging out of a solid and proper basing pattern on big volume. See our "Buy" list for candidates. Always cut your losses at 7%-8% below your purchase price No Matter What.
"Market-Leaders" Moving-Up on Volume: AL, SYNL, CYNO, FSLR, AAPL, IGLD
"Market-Leaders" Moving-Down on Volume: GROW, SPWR

"Let That Be a Lesson" - The Top Three Chart Patterns In Growth Investing.
These chart patterns are the "bread and butter" of good stock trading. Get to know them and they will serve you well now and in the future.

CUP-WITH-HANDLE - This is the best chart pattern a growth stock can have.

- The base must be at least 7 weeks in length, but it can last up to 65 weeks.
- The stock usually corrects 20-30% from the high, but up to 50% in a bear market.
- The handle usually lasts a week or two and should drift sideways or down along it's lows.
- Handles usually correct 10-15%, but up to 20-30% in a severe bear market.
- Handles should form in the upper-half of the cup, preferably within 15% of the old high.
- The handle should form above the 200-day moving average.
The buy point occurs when the price moves above the high of the handle on an increase in volume of a least 50%. The Relative Strength line should lead or closely follow the stock's price into new high ground.

DOUBLE BOTTOM - This is a common base with a good performance history. The price pattern looks like a "W." It should be at least 7 weeks in length.

- The stock starts to correct and then stops, putting in the first part of the "W."
- It then rallies, forming the middle part of the "W."
- The next leg is formed when the stock falls again.
- The final part of the "W" takes shape when the stock rallies again.

The second leg down of the "W" should undercut the first to shakeout the weaker holders. The "pivot point" or buy point occurs when the stock clears the middle part of the "W" on heavy volume.

FLAT BASE - Another very successful and common chart pattern, but it can be as short as 5 weeks in length. This base usually occurs after the stock has broken out and ran up from another base.

- The stock appears to move sideways and usually corrects just 8-12% from it's peak.
- There should be at least one period during the base where the volume drys up at least slightly.
The "pivot point" or buy point occurs when the stock moves above the high of the base on heavy volume.
You will see these patterns over and over if you look at the latest winning stocks or winners of the past. Learn to recognize and trade them and your investing results should improve substantially.

Get aboard the “True Market Leading Stocks” that are “breaking-out” now!
We don't issue lots of stock-picks like the others. But the ones we do are Powerful Stocks that have the potential for gains of 50%-100%, 500% and more.

Sure, our stocks have huge earnings, showing tremendous recent strength, and are being accumulated by the top money managers on Wall St. But it's not enough just knowing their names. You have to know how to trade them. When to buy them and when to sell. Since the average high-growth stock eventually goes down over 70%, this knowledge is valuable. Sign-up today for your FREE TRIAL


Good trading is all about having solid and proven trading rules like the ones I use every day. Rules developed by the world's best traders like William J. O'Neil and Jesse Livermore. You can read more about them here:

THE TOP 12 RULES OF INVESTING You Need To Know

Happy Trading,

Mark Gordon
GOLDENTICKER.COM
Past performance does not guarantee future results. Investing in stocks, bonds, ETFs, and mutual funds involves risk and loss of capital can occur. Consult with your financial advisor before investing in the stock market or making any investment decisions. This blog/website is solely for informational purposes and is not an offer to buy or sell or solicitation of an offer to buy or sell any security or investment product. This material is not to be construed as providing investment services in any jurisdiction where such offers or solicitation would be illegal.

Friday, May 04, 2007


SPECIAL: The "Cup-With-Handle" Chart Pattern
CROX and YHOO Gap-Up on Huge Volume

"From The Trading Desk" May 4, 2007: All 4 major indexes were up in mixed volume again today. The S&P and Dow were both up .2% and the Nasdaq was up .4% in heavier volume. The Dow put in another all-time high. The markets keep grinding higher.

YHOO gapped-up and closed up almost 10% on Microsoft take-over rumors. CROX cleared a cup shaped base on a huge gap to close up almost 20%. The stock blew away earnings estimates and guidance and gapped over our 5% buy limit.

"Current Market Pulse":The market is in a confirmed rally and slowly moving higher. Although things are looking good today, caution is still advised. We are at lofty short-term levels and lesser-quality names are leading the rally. I am recommending caution. Sell your weaker acting stocks. Come off margin. Buy only the best CAN SLIM stocks like the ones we suggest. Only buy stocks that are emerging out of a solid and proper basing pattern on big volume. See our "Buy" list for candidates. Always cut your losses at 7%-8% below your purchase price No Matter What.

"Market-Leaders" Moving-Up on Volume: CROX, FSLR, PCLN, SPWR
"Market-Leaders" Moving-Down on Volume: RYAAY, BBND, AXR

"Let That Be a Lesson" Watch a LIVE video of this important lesson. click here

If there was a "holy grail" in stock chart patterns, it would have to be the "Cup-With-A-Handle." According to William J. O'Neil, - founder of Investors Business Daily and the author of the seminal investing book "How To Make Money In Stocks," this pattern is the strongest one a growth stock can have.

The cup portion of the base starts forming after a previous run-up of at least 30%. During the prior move you want to see weeks of heavy volume where the price moves up. You also want to see the Relative Strength line improving. Look for a clear and definite prior uptrend.

The usual price correction from the peak to the bottom of the cup is usually around 12% - 15% and up to 33%. In a severe "bear market" a cup can sometimes be as deep as 50% or more. Growth stocks normally correct 1 1/2 to 2 1/2 times the general market. Stocks correcting more than this should be avoided.

In most cases the bottom part of the cup should be rounded like a "U" shape and not harsh like a "V." This allows the stock time for the buyers and sellers to find their equilibrium and it takes most of the "speculation" out of the stock.

At the bottom of the cup look for a shakeout or a sudden large price drop and then recovery to scare out the last of the weak holders. You also want to see areas of quiet trade at the bottom.

You also want to see "tight" price action in cup. On a weekly chart, tightness is small price movements from high to low for the week. It's also nice to see nearly un-changed closes for a few weeks as well. Wide price movements attract too much speculative attention to the stock and lessen the likelihood of a successful break-out.

As the stock climbs up and forms the "right" side of the cup you want to see days and weeks of heavy volume price moves. Gap ups on heavy volume are also desirable. Also, the number of heavy volume up-weeks should out-number the number of heavy volume down-weeks. Big volume up weeks, followed by light volume down weeks are good as well.

The Relative Strength line should lead or at least closely follow the stocks price into new high ground.

The cup portion of the base should last 7 weeks minimum to as long as 65 weeks. Most cups last three to six months.

HANDLES
The handle portion of the base is formed after the stock has built the right-side of the cup. A proper handle is at least one or two weeks long and "drifts" down in price along it's lows. Volume will dry up near the bottom of the handle.
If the handle "wedges" up, the handle did not serve to "shake-out" the last of the weaker holders and set-up the next price move. Wedging handles carry significantly more risk that the base will fail.

Handles usually form near the prior high of the cup (the high of the left side) and must form in the upper-half of the cup. The middle point of the handle should be above the middle point of the cup. The handle must also be above the 200-day moving average.

In a "bull market" the handle should drop no more than 10% - 15% from it's peak unless the stock forms a very large cup.

PIVOT POINT
The "buy point" or "pivot point" is usually ten cents above the highest point of the handle. You only want to buy here if the daily volume increases at least 50% above the average daily volume for the last 50 days.


Get aboard the “True Market Leading Stocks” that are “breaking-out” now!
We don't issue lots of stock-picks like the others. But the ones we do are Powerful Stocks that have the potential for gains of 50%-100%, 500% and more.

Sure, our stocks have huge earnings, showing tremendous recent strength, and are being accumulated by the top money managers on Wall St. But it's not enough just knowing their names. You have to know how to trade them. When to buy them and when to sell. Since the average high-growth stock eventually goes down over 70%, this knowledge is valuable. Sign-up today for your FREE TRIAL

Good trading is all about having solid and proven trading rules like the ones I use every day. Rules developed by the world's best traders like William J. O'Neil and Jesse Livermore. You can read more about them here:

THE TOP 12 RULES OF INVESTING You Need To Know
Happy Trading,

Mark Gordon
GOLDENTICKER.COM

Past performance does not guarantee future results. Investing in stocks, bonds, ETFs, and mutual funds involves risk and loss of capital can occur. Consult with your financial advisor before investing in the stock market or making any investment decisions. This blog/website is solely for informational purposes and is not an offer to buy or sell or solicitation of an offer to buy or sell any security or investment product. This material is not to be construed as providing investment services in any jurisdiction where such offers or solicitation would be illegal.

Thursday, May 03, 2007


SPECIAL - "Some Cups Form High-Handles"
Market Rally Continues, But Volume is Mixed

"From The Trading Desk"
May 3, 2007: The markets were all up on mixed volume today. The NASDAQ was up .30% to a new recent high on strong volume, a good sign indeed. The Dow Industrials were up .28% to another all time high on average volume. The S&P500 closed above the 1500 mark for the first time since 2000.
EDU was up 3.26% in heavy trade. CROX was up strongly on increasing volume. VCLK which we recently sold, gapped down 7.57% today and closed below it's 50-dma on heavy volume.

"Current Market Pulse":The market is in a confirmed rally. Although things are looking good today, caution is still advised. We are at lofty short-term levels and lesser-quality names are leading the rally. I am recommending caution. Sell your weaker acting stocks. Come off margin. Buy only the best CAN SLIM stocks like the ones we suggest. Only buy stocks that are emerging out of a solid and proper basing pattern on big volume. See our "Buy" list for candidates. Always cut your losses at 7%-8% below your purchase price No Matter What.


"Market-Leaders" Moving-Up on Volume: NICE, HURN, DWSN, IGLD
"Market-Leaders" Moving-Down on Volume: RYAAY, ANDE

"Let That Be a Lesson" Watch a LIVE video of this important lesson. click here
Some Cups Form "High" Handles - According to William J. O'Neil in his legendary stock market trading book "How To Make Money In Stocks," the cup-with-handle base is the strongest chart pattern for growth stocks to stage a big price move.

In a normal "cup-with-handle" base, the handle ideally starts to form near the high of the left side of the "cup." But sometimes the stock price moves above the old high and and the handle starts forming later. The stock may still be buyable.

Here is a chart of Interparfums Inc. (IPAR) for May 3, 2007. We see that the left side of the cup topped out at 21.77 on November 17, 2006. The stock's base has shown good accumulation and the Relative Strength line is strong.

Interparfums never formed a proper handle before it crossed the "buy point" ($21.87 or the prior high, plus ten cents). Then on April 20, 2007 IPAR blasted out of the base on huge volume, a very good sign.

The stock closed at $23.46, or 7.27% above the proper "buy point." At this point the stock was already too far extended in price to buy. Our rules tell us not to purchase stocks more than 5% past the "buy point."

Patience seems to have paid off however. The stock formed an eight day handle (more than the 1 week minimum required). There were areas of quiet trade on the 3rd, 4th, and 5th days. And the handle "drifted" down slightly which serves to "wear-out" some of the "weaker" holders.

On May 3rd, IPAR blasted out of it's high-handle on the biggest volume the entire base has seen. It closed just below it's new "buy point" of $23.63 at $23.48.
Get aboard the “True Market Leading Stocks” that are “breaking-out” now!
We don't issue lots of stock-picks like the others. But the ones we do are Powerful Stocks that have the potential for gains of 50%-100%, 500% and more.

Sure, our stocks have huge earnings, showing tremendous recent strength, and are being accumulated by the top money managers on Wall St. But it's not enough just knowing their names. You have to know how to trade them. When to buy them and when to sell. Since the average high-growth stock eventually goes down over 70%, this knowledge is valuable. Sign-up today for your FREE TRIAL


Good trading is all about having solid and proven trading rules like the ones I use every day. Rules developed by the world's best traders like William J. O'Neil and Jesse Livermore. You can read more about them here:

THE TOP 12 RULES OF INVESTING You Need To Know

Happy Trading,

Mark Gordon
GOLDENTICKER.COM

Past performance does not guarantee future results. Investing in stocks, bonds, ETFs, and mutual funds involves risk and loss of capital can occur. Consult with your financial advisor before investing in the stock market or making any investment decisions. This blog/website is solely for informational purposes and is not an offer to buy or sell or solicitation of an offer to buy or sell any security or investment product. This material is not to be construed as providing investment services in any jurisdiction where such offers or solicitation would be illegal.

Wednesday, May 02, 2007


SPECIAL - "How To Spot Market Tops"
Markets Rally Broadly, But Volume is Lackluster

"From The Trading Desk"
May 2, 2007: The markets rallied broadly but on lower volume. The NASDAQ was up 1.04% on less volume and recouped the prior three day's losses. The S&P500 was up .65% to a new high, recouping the prior losses as well. Volume was also lighter.

The DOW continued its run to another new high but it was tempered by lower volume. CROX was up 4.7% on strong volume. VIP was up 5.25% on good volume. ROCM fell even more after it's huge collapse in prior days. CTSH failed to rally above it's 50-dma.

"Current Market Pulse":The market is in a confirmed rally. Although things are looking good today, caution is still advised. We are at lofty short-term levels and lesser-quality names are leading the rally. I am recommending caution. Sell your weaker acting stocks. Come off margin. Buy only the best CAN SLIM stocks like the ones we suggest. Only buy stocks that are emerging out of a solid and proper basing pattern on big volume. See our "Buy" list for candidates. Always cut your losses at 7%-8% below your purchase price No Matter What.
"Market-Leaders" Moving-Up on Volume: VOCS, RTI, CBG
"Market-Leaders" Moving-Down on Volume: ROCM, HWCC, CTSH, GRMN

"Let That Be a Lesson" Watch a LIVE video of this important lesson. click here

"How To Spot Market Tops" - When the "big boys" (institutional investors like mutual funds, banks, pension funds, insurance companies, etc) head for the exits, you need to as well.

They control an estimated 80% of the price action of the US stock market, so it pays to know what they are doing. Since they are so big, they leave tracks behind. By keeping a close watch on the markets you can step aside and not have to "ride" the markets down during their "gut-wrenching" declines of 15%, 25%, 50% and more.

The best way to gauge if the institutional players are exiting the market is to watch what for we call "distribution days." Simply, this is when one of the major indexes ( the NASDAQ, S&P 500, Dow Industrials, NYSE Composite) is down more than .2% on heavier volume than the previous session.

Not all indexes have to fall at the same time. If only one of the gauges suffers heavy distribution that still can signal trouble ahead.

When the market racks up four of five of these in a few weeks time, chances are the rally is in trouble and the market may reverse lower.

Above is a chart of the NASDAQ in 2000 as it peaked on March 10th and then started it's massive decline. The first day of heavy distribution came 3 sessions prior to the peak. The index fell for several sessions putting in another distribution day, then tried to rally back.

That rally stalled in late March and then the NASDAQ racked-up three days of heavy distribution in a row. A definite signal to exit the markets. The index also sliced through it's 50 day moving average on heavy volume, another major sell signal.

The NASDAQ put in a total of 9 distribution days in a month's time. During all this, scores of market "pundits" were telling investors to "buy the dips." Many individuals who did not heed the real warning signs lost a lot of money and those who stayed on margin were most likely wiped out. This ended up being one of the biggest collapses in Wall St. history.

Don't panic if the market flashes a few distribution days from time to time. The market can't go higher without taking an occasional breather now and then. It's when they pile up in a very short time that you need to worry.

Also, not every distribution day should cause you concern. Higher volume selling after a holiday usually means that more people are now back after a quiet pre-holiday period.

"Churning" near the top is also a sign of distribution. This is when the market is not advancing near the top but the volume is brisk. This means that there is a lot of institutional trading going on, but the buyers' demand is not strong enough to push prices up.

When you see heavy distribution in the markets you must act quickly. If you are on margin, get off! Sell your weaker acting stocks. If selling persists, raise cash to protect your hard earned assets. Don't listen to the experts, listen to the markets.

Get aboard the “True Market Leading Stocks” that are “breaking-out” now!
We don't issue lots of stock-picks like the others. But the ones we do are Powerful Stocks that have the potential for gains of 50%-100%, 500% and more.

Sure, our stocks have huge earnings, showing tremendous recent strength, and are being accumulated by the top money managers on Wall St. But it's not enough just knowing their names. You have to know how to trade them. When to buy them and when to sell. Since the average high-growth stock eventually goes down over 70%, this knowledge is valuable. Sign-up today for your FREE TRIAL

Good trading is all about having solid and proven trading rules like the ones I use every day. Rules developed by the world's best traders like William J. O'Neil and Jesse Livermore. You can read more about them here:

THE TOP 12 RULES OF INVESTING You Need To Know
Happy Trading,

Mark Gordon
GOLDENTICKER.COM

" Past performance does not guarantee future results. Investing in stocks, bonds, ETFs, and mutual funds involves risk and loss of capital can occur. Consult with your financial advisor before investing in the stock market or making any investment decisions. This blog/website is solely for informational purposes and is not an offer to buy or sell or solicitation of an offer to buy or sell any security or investment product. This material is not to be construed as providing investment services in any jurisdiction where such offers or solicitation would be illegal.

Wednesday, April 18, 2007

GoldenTicker.com Analyzes GROW-2007-04-18
GROW is making an amazing recovery after an early year sell-off. A super strong stock in a strong industry group, that is running up on heavy volume. Firm uses CAN SLIM and quantative analysis to pick stocks in China and India and other emerging markets.

The stock is shaping a classic Cup with Handle formation with the handle pulling back on lighter volume, a very bullish formation.

Mark Gordon is the Chief Marktet Strategist for GoldenTicker.com - a leading stock picking service. Mr. Gordon is one of the few individuals to be CAN SLIM certifed, recognizing him as a stock market expert.

www.goldenticker.com
blog: goldenticker.blogspot.com

Wednesday, March 28, 2007

IS STAGFLATION HERE? - Fed Chairman Ben Bernanke spoke today and the markets clearly didn't like what he had to say. The NASDAQ and other indexes all fell .8% today in higher volume making it the first distribution day since this latest rally began on March 21st.

Technically the rally will stay in tact unless we get 4 or 5 distribution days within a 4-week period (or if the market under-cuts the previous lows.)

Stagflation, a portmanteau of the words stagnation and inflation, is a term in macroeconomics used to describe a period of high price inflation combined with slow output growth, high unemployment, or recession. "Stag" refers to a sluggish economy, while "flation" signifies rapidly rising consumer prices.

Bernanke said the sub-prime mortage debacle was a "threat" to the housing recovery which by itself may have meant he wants to ease interest rates. But then the markets began selling off almost immediately when he said "core inflation readings were "uncomfortably high." Is the Fed now "caught between a rock and a hard place?"

Seems Mr. Bernanke may not be such a "Helicopter Ben" after all. Of course I'm referring to the famous speech where he said he would "drop dollars from helicopters" to stimulate the economy if he had to.

In the mean time the markets remain in rally mode and currently our portfolio has 4 top-rated stocks in the Buy Zone, 5 Setting-Up, and 6 Off and Running.


Thanks for stopping by. Every day I will be looking for top stocks showing exceptional strength, and I will also be keeping an eye on things as they can quickly change. Please look for my recent stock picks at The GOLDEN TICKER.


It's always a good idea to review THE TOP 12 RULES OF STOCK INVESTING YOUR BROKER OR ADVISOR WILL NEVER TELL YOU.


Happy Trading,

Mark Gordon

Chief Market Strategist
GOLDENTICKER.COM

Past performance does not guarantee future results. Investing in stocks, bonds, ETFs, and mutual funds involves risk and loss of capital can occur. Consult with your financial advisor before investing in the stock market or making any investment decisions. This blog/website is solely for informational purposes and is not an offer to buy or sell or solicitation of an offer to buy or sell any security or investment product. This material is not to be construed as providing investment services in any jurisdiction where such offers or solicitation would be illegal.

Monday, March 26, 2007

THE TOP 12 RULES OF STOCK INVESTING
YOUR BROKER OR ADVISOR WILL NEVER TELL YOU

THE DIRTY LITTLE SECRET
If you are a growth investor (and you should be if you want to
make big money) you should know that this is a trecherous game.

Although growth stocks can deliver powerul gains of 100% - 1,000%
and more, they also eventually lose over 70% of their value on average!

You need to know how to protect your gains or you will be crushed!

The following rules may be the most important stock market information you will ever read!

Print them, and commit them to memory. Your financial future may depend on it.


# 1 - THE MOST IMPORTANT RULE
Sell immediately if your stock falls 7- 8% below your purchase price.

NO EXCUSES!


DON'T EVEN THINK ABOUT INVESTING IN GROWTH
STOCKS IF YOU CAN'T FOLLOW THIS RULE!


Hint: We give you the proper stop loss target for each of our stock picks. We suggest entering an automatic stop loss with each purchase unless you are a very experienced trader.

# 2 - YOU CAN "TIME" THE MARKETS
Hold stocks only when the overall trend of the market is up. It’s very
hard to make money when the market is not acting well - so just get out.

We use an accurate "market timing" system that would have kept you out of the 2000 "tech wreck" and the big crash of 1929!

3 out of 4 stocks follow the general market trend! You DO NOT have to be in the market all the time.

“The stock market generally goes up 1/3 of the time, down 1/3 of
the time, and sideways 1/3 of the time.” --- Jesse Livermore

Hint: By reading our daily Market Updates you will always be "in tune" with the market. By avoiding severe market downturns your investing results should substantially improve.


# 3 - STOCKS MAKING "NEW HIGHS" TEND TO GO HIGHER!
In other words don't "buy low and sell high, buy high and sell higher."

This goes against our basic human nature. We tend to think if something is selling at a lower price than before, it's a bargain. Not in the stock market.

"Bottom-fishing" is a sure way to lose money.

Hint: Our technical buy rules only lead us to the strongest stocks at or near new 52 week price highs.


# 4 - BUY ONLY THE BEST STOCKS
Concentrate on the top 2 or 3 stocks from the top Industry Groups.
“Best of breed” stocks will make you the most money.

The group leaders usually make the biggest moves, while the "also rans" barely budge.

“The key groups lead the market up and down” --- Jesse Livermore


#5 - BUY ON FUNDAMENTALS AND TECHNICALS
(But Always Sell on Technicals)

Buy only the best stocks, with the best fundamentals, coming out of solid price patterns.

Be patient; wait for proper bases to form, and never buy unless the stock’s breakout is on “big” volume (50%+ above average).

Only enter trades with the “wind at your back.”

“Huge volume breakouts are the best clue that a stock is going much higher.” --- William O’Neil

Hint: We monitor the markets daily looking for the handful of superior stocks that meet our exacting standards. We do the work so you don't have to.


#6 - NEVER FOLLOW A STOCK TIP
Listen to the market and individual stocks - not the "experts" or your friends.

Our stock picking system is based on how the markets really work, not on rumors or advice from the many TV, radio, internet, and newspaper pundits.

Hint: We use many of the same rules and principles developed by the world's greatest traders.
Rules that have stood the test of time. Very little changes in the stock market over the years because basic human nature never changes.


#7 - “DEFENSE is MOST of the GAME .
Leading growth stocks typically correct 70% or more from their highs and can devastate your portfolio.

“The leaders of the current bull market are typically the losers of the next.” --- William O’Neil

You must learn and commit to memory solid sell rules to protect your
hard earned gains or they could be wiped out.

Hint: We have a dedicated an entire section of our training program to
market-tested sell rules that have stood the test of time.


#8 - NEVER BE SCARED OFF BY HIGH P/E's
If you are not willing to pay an average of 25 to 50 times earnings (or even much more) for growth stocks, you automatically eliminate most of the past great investments available like GOOGLE, APPLE, CISCO, etc.

The stock market is essentially an auction marketplace and stocks tend to generally sell for about what they are worth. Hi P/E's show big demand for the stock.

Hint: We only look for the best quality stocks regardless of P/E's. Period.


# 9 - AVOID CHEAP STOCKS
Concentrate on stocks priced above $15.

Big institutions (mutual funds, banks, insurance companies, pension funds, and hedge funds) control 80% of the buying, and most of them wouldn't even consider buying a stock under $15 or $20, so why should you?

Obviously, stay far away from penny-stocks and stocks on the "pink sheets."

Hint: We base part of our stock selection on "institutional sponsorship." The stock must be being bought buy highly rated institutions for us to even consider it.


#10 - LEARN HOW TO TAKE A PROFIT
Most stocks run up 20-25%, then correct.
Take profits on most stocks as soon as they run up this amount.

Most people never learn this and watch their gains disappear time after time.

Hint: We give you target prices with each stock pick to help you avoid this common mistake.


#11 - KNOW WHEN TO LET YOUR PROFITS RUN
If your stock runs up 20% or more in the first 3 weeks – try to hold for at least 8 weeks (unless a major sell signal is triggered.)

These stocks tend to be your real winners capable of going up 50%-%100, %500 or more!

“It’s not the trading that makes you money in the markets, it’s the sitting.” --- Jesse Livermore

Hint: You will need to master our sell rules to be able to maximize your gains.


#12 - DON'T OWN TOO MANY STOCKS
Experienced investors should hold no more than 6-8 stocks.
When you get aboard a big winner, you want it's performance
to have a big effect on your portfolio.

Also, it's nearly impossible to follow 15 or 20 stocks properly.

Always sell your worst performing stocks and move the money into your best ones. Your best performers should always be your biggest positions.

You will make your “big” money in just a few stocks in every bull market.

Many of the great investors start with 6 or 8 stocks and end up "force feeding" their best stocks, ending up with 2 or 3.

This kind of discipline is what can make you rich in the stock market!

Hint: Our training shows you the optimal number of stocks to own for any size portfolio.


THIS WORKS!
You will be directed toward many “life changing” young companies in vigorous infant industries that have great earnings and fundamentals, and that are setting up for a “big volume” move out of a solid consolidation pattern after a previous big move.

We live in fantastic time of innovation and prosperity.
Incredible opportunities happen every year in America.

We wish you unlimited success!

Happy Trading,

Mark Gordon
Chief Market Strategist
GOLDENTICKER.COM

"Past performance does not guarantee future results. Investing in stocks, bonds, ETFs, and mutual funds involves risk and loss of capital can occur. Consult with your financial advisor before investing in the stock market or making any investment decisions. This blog/website is solely for informational purposes and is not an offer to buy or sell or solicitation of an offer to buy or sell any security or investment product. This material is not to be construed as providing investment services in any jurisdiction where such offers or solicitation would be illegal.